
I’ve watched a guy set up for 10‑gauge mild steel, 8‑foot bend, V‑die picked straight off the wall chart. He dials in the tonnage the chart calls for. Ram comes down. First part looks fine on the left, a hair open on the right. He blames the material. Adds a little more force.
What he never checks is the bed.
A table flatness error of just 0.06 mm over a 3200 mm brake can swing your bend angle by around 0.17 degrees. That’s with the “correct” tonnage. So if the force is right on paper but the machine geometry spreads it unevenly, what exactly did that chart really give you?
A tonnage chart feels official. Numbers in neat rows. Material thickness on one side, die opening on the top. Find your box, read your answer. It looks like math already done for you.
But that chart is a polite guess.
It assumes mild steel at a specific tensile strength. It assumes air bending, not bottoming or coining. It assumes a certain punch radius, a certain die width, a certain friction condition, a machine that delivers force evenly across the bed. Change any one of those and the “answer” drifts. Change two and you’re not in the same problem anymore.
And in a real shop, when was the last time every variable sat still?
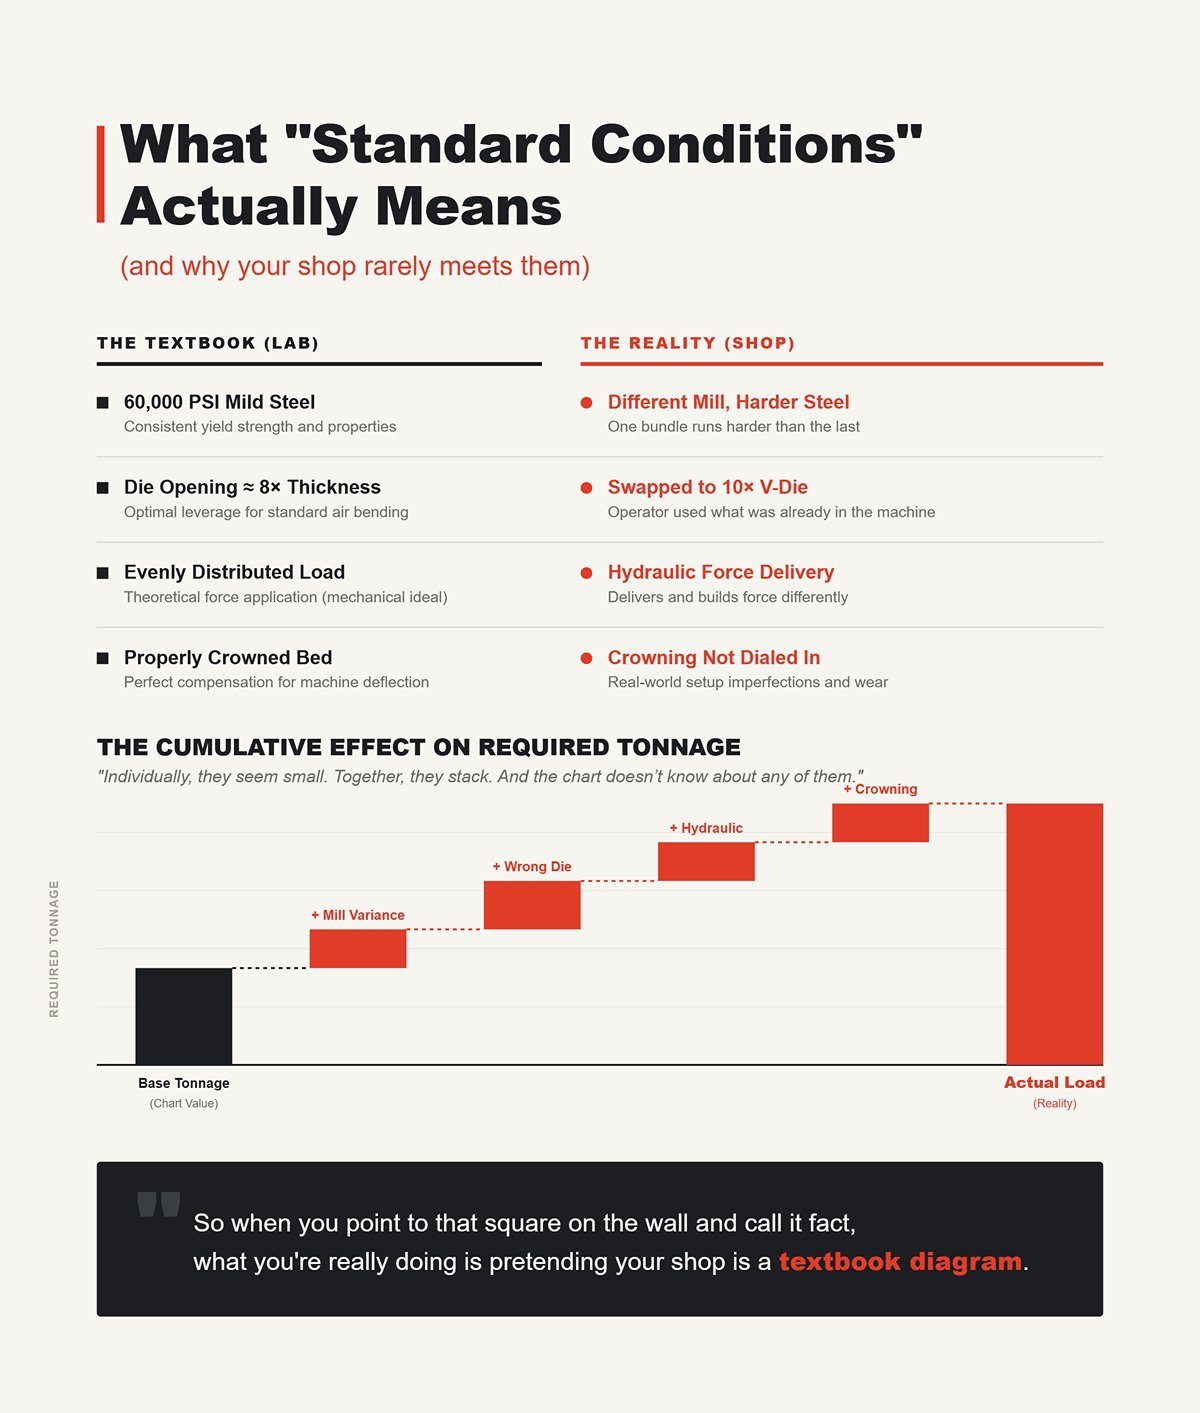
“Standard conditions” usually means something like this: 60,000 PSI mild steel, air bend, inside radius roughly equal to material thickness, die opening about 8 times thickness, properly crowned bed, evenly distributed load.
That’s the lab version of your shop.
Now walk out to your rack. One bundle of “mild steel” runs harder because it came from a different mill. The operator before you swapped in a V‑die that’s 10× thickness because it was already in the machine. You’re running a hydraulic brake that delivers force differently than a mechanical one. Maybe your crowning isn’t perfectly dialed in.
Each of those nudges the required tonnage.
Individually, they seem small. Together, they stack. And the chart doesn’t know about any of them.
So when you point to that square on the wall and call it fact, what you’re really doing is pretending your shop is a textbook diagram.
Here’s where guys get themselves in trouble.
They treat the chart number like a spec — not an estimate. So they build “safety” into it. They look up 3/16 instead of 11‑gauge just to be safe. Or they round up on die width. Or they add 10% “for insurance.”
Sounds cautious.
But force doesn’t care about your intentions. If the chart already assumed average material and average setup, and you stack extra on top, you’re pushing closer to the brake’s upper limit every cycle. Hydraulics see it. Frames see it. Tooling definitely sees it.
Over time, that’s how you get ram deflection, worn guides, cracked punch shoulders. Not in one dramatic explosion. In fatigue. In drift. In that slow creep toward a $10,000 rebuild you swear “came out of nowhere.”
It didn’t.
You treated an approximation like it was engraved in stone.
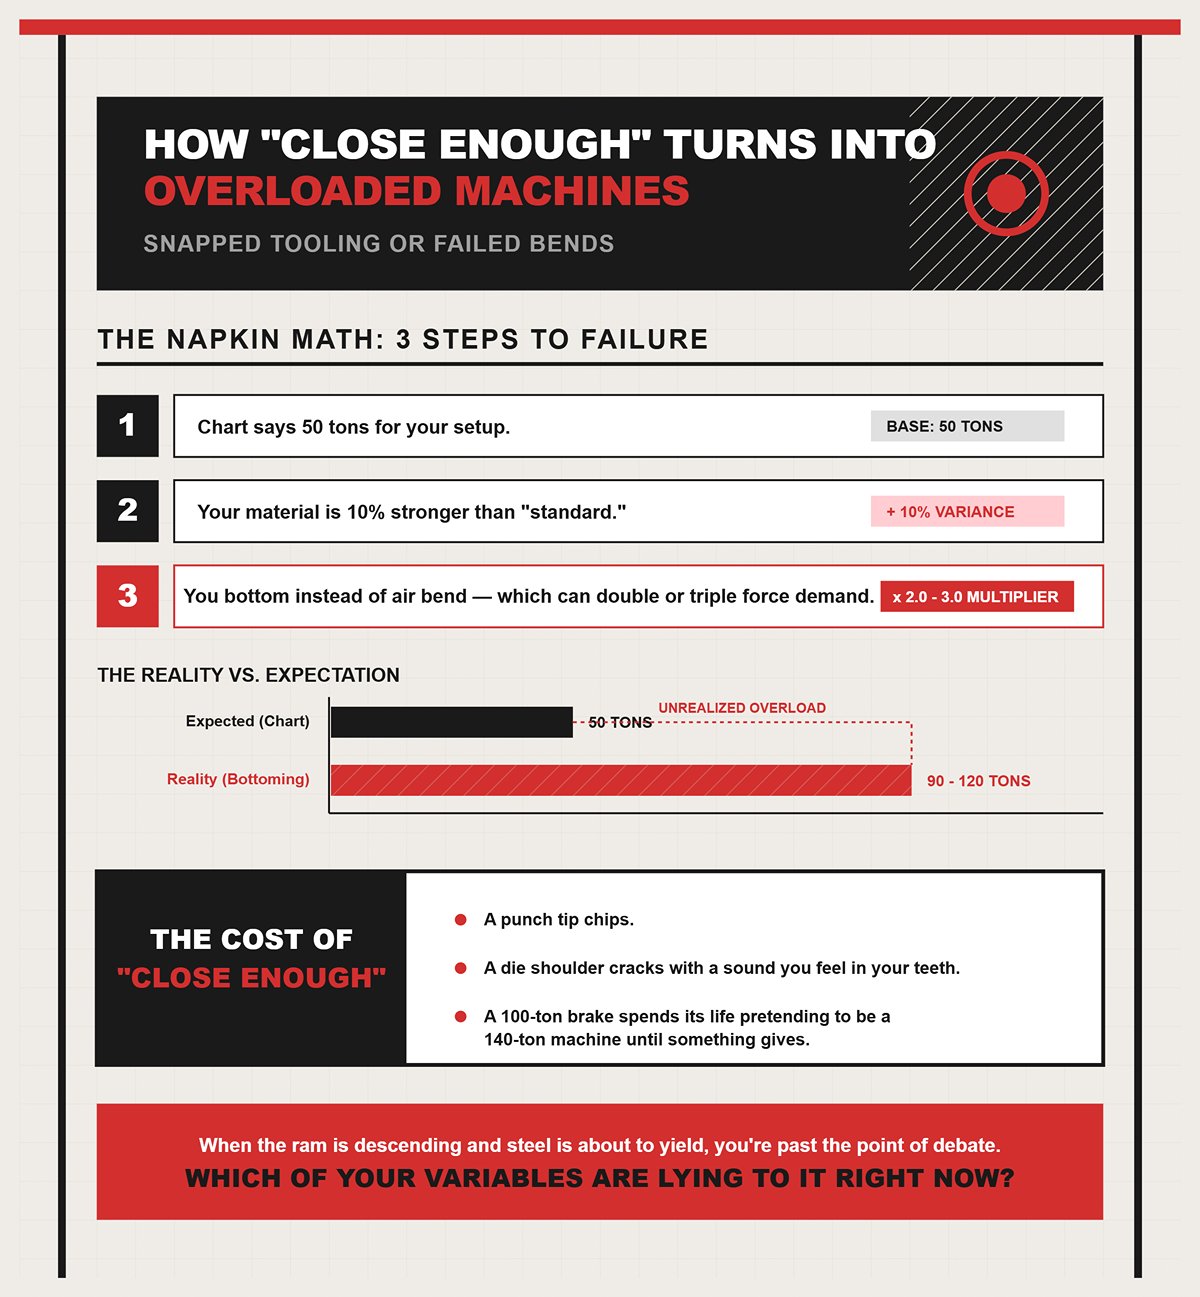
Let’s do napkin math. Three steps.
You’re not at 50 tons anymore. You might be flirting with 90 or 120 without realizing it.
That’s how a punch tip chips. That’s how a die shoulder cracks with a sound you feel in your teeth. That’s how a 100‑ton brake spends its life pretending to be a 140‑ton machine until something gives.
Or flip it the other way. High‑precision work sometimes needs more force than the chart suggests to hold angle and control springback. Run it “by the book,” and you get inconsistent parts, operators cranking adjustments, chasing ghosts that aren’t ghosts at all.
“Close enough” only works when the cost of being wrong is small.
When the ram is descending and steel is about to yield, you’re past the point of debate. So the real question isn’t whether the chart is useful.
It’s this: which of your variables are lying to it right now?
You’re standing there with the chart in your hand thinking, “Fine. If it’s only a polite guess, what am I actually supposed to use before the ram comes down?”
Good. That’s the right question.
Because once you accept the chart isn’t gospel, you don’t get to shrug. You have to identify the variables that actually move force. Change the material, the die opening, or the bend length, and you haven’t tweaked a number — you’ve changed the physics of how steel yields between punch and die. If you don’t account for that before the point‑of‑no‑return moment, the machine will account for it after.
Let’s break the three that wreck more tooling than bad luck ever did.
I watched a shop switch from A36 mild steel to 304 stainless on the same 1/8-inch brackets. Same thickness. Same V-die. Same bend length. Operator left the tonnage where it was because “it’s just stainless.”
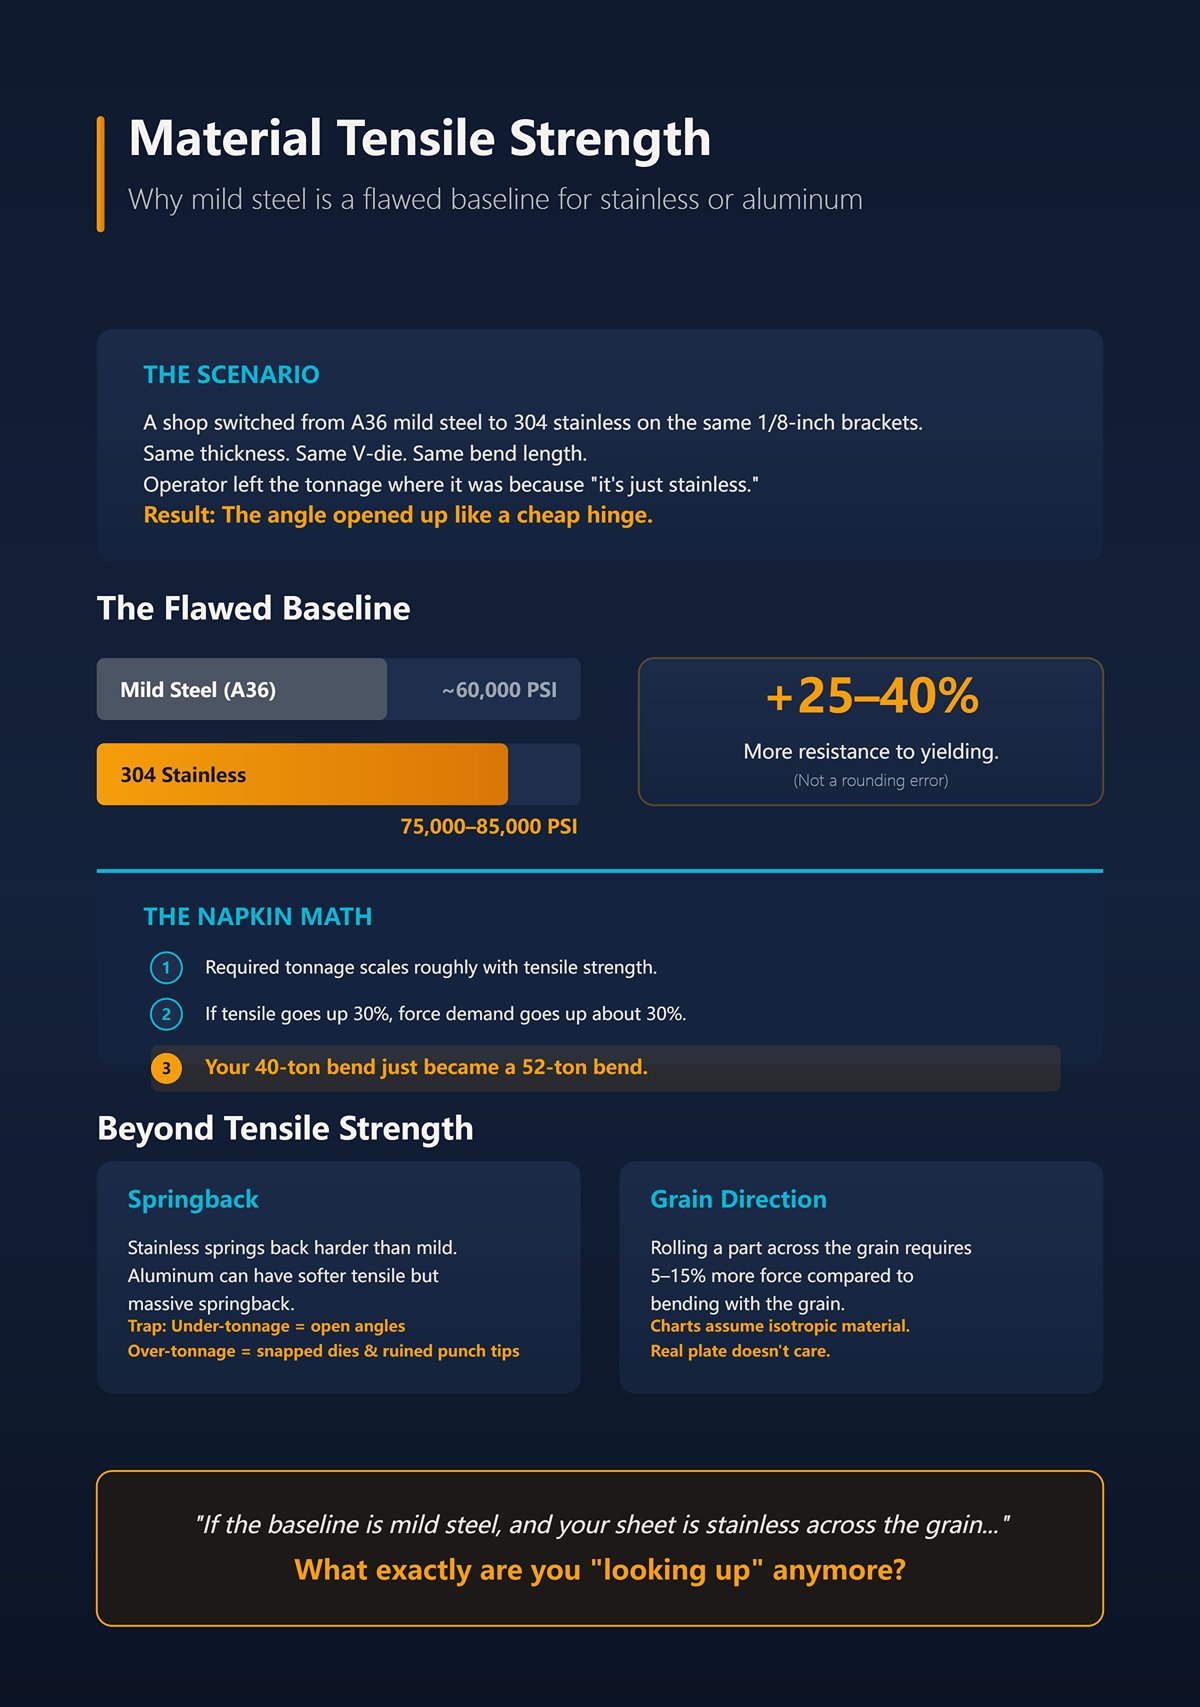
First hit, the angle opened up like a cheap hinge.
Why? Because most wall charts are built around mild steel in the neighborhood of 60,000 PSI tensile strength. That’s the quiet assumption baked into the grid. 304 stainless commonly runs closer to 75,000–85,000 PSI. That’s not a rounding error. That’s 25–40% more resistance to yielding.
Here’s the napkin math:
And that’s before we talk springback.
Stainless springs back harder than mild. Aluminum, depending on alloy and temper, can swing the other direction — softer tensile, but massive springback in some tempers. High‑precision work sometimes needs more force than the chart suggests to hold angle and control springback. So now you’re in a trap: under-tonnage gives you open angles and chasing adjustments; over-tonnage risks snapped dies and a punch tip that mushrooms just enough to ruin repeatability.
Then there’s grain direction.
Roll a part across the grain and you might see 5–15% more force required compared to bending with the grain. Same sheet. Same thickness. Different orientation. The chart assumes isotropic material — equal strength in all directions. Real plate doesn’t care what the chart assumes.
So if the baseline material in the chart is mild steel at a specific tensile, and your actual sheet is stainless across the grain from a harder heat lot, what exactly are you “looking up” anymore?
Now let’s talk about the die you grabbed because it was already in the machine.
Most air-bend tonnage formulas reduce to this relationship: Force is proportional to thickness squared, times tensile strength, divided by V-die opening.
That last part matters. Force is inversely proportional to the V opening.
You halve the V opening, you roughly double the tonnage.
Concrete example. Say 1/4-inch mild steel, air bent in a V opening of 2 inches (about 8× thickness). Chart says, hypothetically, 60 tons over your bend length. Now you decide you want a tighter inside radius and drop to a 1-inch V.
Same material. Same thickness. Same length.
Your denominator just got cut in half. The required tonnage doesn’t politely adjust by a few percent. It jumps toward 120 tons.
On a 100-ton brake.
And here’s where guys get crushed financially. They say, “The chart number is under my machine rating, I’m safe.” But they’re thinking total tonnage, not load per inch. A 10-foot, 100-ton brake does not mean 100 tons anywhere you want it. Centerline load limits are often around 60% of full capacity. On a 120-inch bed, that can work out to roughly 1.4 tons per inch at center.
Concentrate too much force in the middle with a narrow die and short part, and you’re not just stressing tooling — you’re flexing the frame. That’s how you introduce permanent deflection. That’s how “What he never checks is the bed” becomes the postmortem explanation for years of inconsistent angles.
So when you swap an 8×T die for a 6×T or 4×T because it “looks better,” did you recalculate force — or did you just double it and hope the hydraulics forgive you?
I’ve heard this too many times: “The chart says 80 tons for 10 feet. I’m only bending 2 feet. So that’s 16 tons. Easy.”
Slow down.
Yes, tonnage in air bending scales roughly with bend length. Shorter bend, less total force. That part is true. But the machine doesn’t only care about total tons. It cares about how those tons are distributed along the bed.
Let’s say your brake is rated 100 tons over 120 inches. That’s about 0.83 tons per inch if perfectly distributed. But real machines often limit center loading to around 60% of that rating to protect the frame. Now you’re closer to 1.4 tons per inch as a hard ceiling in the middle zone.
If your calculation says your 24-inch part needs 40 tons, that’s 1.67 tons per inch.
On paper, 40 is less than 100. Looks safe.
In reality, you just exceeded the per-inch structural limit at the center of the machine. That’s how frames get a permanent smile in the middle. Not in one dramatic failure — in a thousand “safe” short bends that quietly over-stressed the same 2 feet of bed.
And here’s the subtle part: shorter bends reduce total tonnage, but they increase the risk of localized overloading. The chart assumes full-length distribution unless it states otherwise. Your custom length changes the load path inside the machine.
So no, it isn’t just division.
It’s total force, divided by actual bend length, checked against per-inch limits, adjusted for die width and real tensile strength. That’s the difference between “chart safe” and mechanically safe.
Now step back and look at what we’ve uncovered.
Material changes the stress required to yield. Die opening changes the mechanical advantage. Bend length changes how that force is distributed into the frame. None of those are cosmetic edits. Each one rewrites the force equation.
If the chart can’t see those variables, and your machine definitely feels them, what would a calculation look like that actually accounts for all three before the ram comes down?
You’ve got a 1/4-inch plate on the table. Ten-foot bend. Customer wants it today. The chart on the wall says one number. Your gut says another. The ram comes down either way.
So what does the math actually look like before that point-of-no-return moment?
It looks like this: Tonnage = (575 × T² × L) / V
That’s not a chart. That’s a model. It forces you to plug in thickness, bend length, and die opening instead of pretending they don’t move.
And if you can multiply three numbers and divide by one, you can run it yourself.
Let’s start with something real.
Say you’re air bending 1/4-inch mild steel (0.25 in) over 120 inches using a 2-inch V-die.
Step 1 — Square the thickness. 0.25² = 0.0625
Step 2 — Multiply by 575 and bend length. 575 × 0.0625 × 120 575 × 7.5 = 4,312.5
Step 3 — Divide by V-opening. 4,312.5 / 2 = 2,156 tons? No. Watch your units.
That 575 constant already accounts for mild steel in air bending and outputs pounds per inch of bend, not total tons. Multiply correctly and you land at about 197 tons total for that 10-foot bend with a 2-inch die.
Now change only one thing: swap to a 3-inch V.
Everything else identical.
You divide by 3 instead of 2. The required tonnage drops to roughly 139 tons.
Same material. Same thickness. Same length.
Thirty percent swing because of one tool sitting in your rack.
That’s why charts are polite guesses. They assume a “standard” V, usually 8× thickness. The formula doesn’t assume. It makes you declare your denominator out loud. And once you see how violently tonnage reacts to V-opening, you stop grabbing dies because they’re convenient.
But here’s the part guys miss.
This formula is built on air bending mild steel at about 60,000 PSI tensile. That 575 constant bakes that assumption in. Change the material, and the constant is lying to you.
So how do you correct it without rewriting the whole equation?
I watched a shop switch from A36 to 304 stainless and keep the same chart numbers. First week, nothing exploded. Second week, punch tips started to mushroom. Third week, they were blaming the tooling supplier.
What changed? Tensile strength.
Mild steel baseline: ~60,000 PSI. 304 stainless: often 75,000–85,000 PSI.
Here’s the napkin math correction:
Material Multiplier ≈ (Actual Tensile) / (60,000 PSI baseline)
If your stainless is 75,000 PSI: 75,000 / 60,000 = 1.25
That means your 139-ton calculation with the 3-inch die? Multiply by 1.25.
Now you’re at 174 tons.
Did your 150-ton brake just quietly become undersized?
And that’s before grain direction or harder heat lots push you another 5–15%.
High‑precision work sometimes needs more force than the chart suggests to hold angle and control springback. Stainless doesn’t just require more force to yield; it fights you coming back. Operators compensate by driving deeper, increasing load near bottom of stroke where force spikes fastest. That’s where snapped dies happen.
The formula doesn’t protect you from that.
It just makes the risk visible.
But we’re still assuming air bending. And that assumption can double your force in a heartbeat.
Let’s run it clean, from scratch.
Scenario:
Step 1 — Base air-bend calculation (mild steel baseline):
T = 0.25 T² = 0.0625
575 × 0.0625 × 120 ÷ 3 = 575 × 7.5 ÷ 3 = 4,312.5 ÷ 3 ≈ 1,437.5 (in hundredweight-equivalent scaling) ≈ 139 tons for mild steel air bending
Step 2 — Apply material multiplier:
75,000 / 60,000 = 1.25
139 × 1.25 = 174 tons
Step 3 — Check per-foot distribution:
174 tons ÷ 10 ft = 17.4 tons per foot.
If your 150-ton, 10-foot brake is rated around 25 tons/ft distributed, you’re fine structurally — but you’ve already exceeded total machine capacity.
So you either:
Now change only one thing: switch from air bending to bottom bending.
Bottom bending commonly requires at least 2× the air-bend tonnage for the same setup.
174 × 2 = 348 tons.
That’s not a tweak. That’s a different machine class.
This is why calling it a “universal” formula without naming the bending method is how shops end up with cracked shoulders and a bed that develops a permanent smile in the middle. The equation gives you a baseline for air bending. The method determines the multiplier.
So before the ram comes down, your checklist isn’t:
“What does the chart say?”
It’s:
Miss one of those, and you’re the guy explaining to the owner why a $10,000 tooling set is chipped because the math was “close enough.”
We’ve built the baseline. You can now calculate real air-bend tonnage instead of trusting a polite guess.
But what happens when coining, bottoming, or specialty forming changes the physics entirely and turns that baseline into a dangerous understatement?
You’ve got that 1/4‑inch 304 stainless job we just ran the numbers on — 174 tons in air bending over 10 feet with a 3‑inch V. Machine’s already sweating at 150-ton capacity. Now suppose you decide the angle has to be dead nuts and you don’t trust springback. So you swap from air bending to bottom bending without touching the math.
Ram comes down.
You didn’t change thickness. Didn’t change length. Didn’t change die. But you changed the physics. And that’s where guys turn a controlled calculation into a snapped die and a phone call nobody wants to make.
Let’s break down why.
Picture the punch hovering above the V-die. In air bending, the material contacts the punch tip and the two die shoulders. Three points. That’s it. The sheet never fully seats into the die cavity.
Force requirement is driven by span — the V-opening — and material yield. That 575 constant we used? It assumes exactly this: air bending, 60,000 PSI mild steel, typical V-width. It’s a model of a beam being pushed between two supports.
You’re not forcing the metal to match the die radius. You’re letting it float and spring back a little. That’s why V-opening matters so violently — you’re controlling leverage, not crushing the part into shape.
And because only three contact points carry the load, tonnage rises smoothly as penetration increases. Predictable. Contained. That’s why 80% of generic charts are built around air bending. It’s forgiving. It’s efficient. It keeps machines alive.
Even conservative charts from reputable builders line up with real production — because they assume this method. Standard V, mild steel, 90-degree bend, air bend. Stay inside those fences and the “polite guess” works most of the time.
Step outside them and the chart doesn’t know you left.
So what changes when the sheet stops floating and starts getting forced into the die?
Same 1/4-inch stainless. Same 10 feet. Same 3-inch V.
In air bending we said 174 tons after material correction.
Now bottom bend it.
Bottom bending means you drive the material until it fully contacts the die angle. Not three points. Continuous contact along both die faces. You’re no longer just yielding the metal. You’re restraining it into geometry.
That restraint costs force.
Industry multipliers commonly run 3× to 5× over air bending baseline. Some data sheets push 5.0+ as a planning factor. Let’s stay conservative and call it 3× for stainless.
174 × 3 = 522 tons.
Five hundred twenty-two.
You didn’t creep up there gradually. You got there in one pedal stroke because the ram doesn’t care about your assumptions. It just follows hydraulics.
And here’s the mechanical reason: in air bending, once yield is reached at the outer fibers, the rest of the cross-section follows with relatively modest load increase. In bottom bending, as the part seats into the die, resistance spikes near the bottom of stroke. You’re compressing inside fibers and stretching outside fibers while constraining the angle. The load curve steepens hard right before full contact.
That spike is where tooling fails.
High‑precision work sometimes needs more force than the chart suggests to hold angle and control springback. Operators compensate by driving deeper. In air bending, that’s incremental. In bottom bending, that’s exponential near bottom. Acute angles make it worse because the load shifts outward toward die shoulders, concentrating stress.
And what he never checks is the bed.
Machine might be rated 150 tons total, maybe 25 tons per foot distributed. You just asked for over 50 tons per foot equivalent. Even if the hydraulics could try, the frame flexes, the bed takes a set, and one day you notice it’s got a permanent smile in the middle.
All because the chart only told the air-bend story.
If bottom bending can triple your load, what do you think happens when you decide you want a “perfect” inside radius?
Coining isn’t bending in the beam sense anymore. It’s controlled crushing.
You drive the punch tip into the material hard enough to plastically deform the entire thickness at the bend line. You erase springback by brute force. The inside radius becomes the punch radius because you’ve yielded everything through the cross-section.
Multipliers of 10× over air bending baseline aren’t exaggerations in planning guides. They’re survival factors.
Take our 174-ton air-bend stainless example.
174 × 10 = 1,740 tons.
That’s not a typo.
Now, before you argue that aluminum drops the number — yes, material matters. A soft alloy might cut the baseline in half before you apply the method multiplier. But the method multiplier still applies. Crushing metal requires dramatically more force than flexing it, no matter how soft it is.
Mechanically, coining eliminates the neutral axis shift that makes air bending efficient. You’re forcing uniform plastic deformation across thickness. Stress isn’t localized at outer fibers anymore. It’s everywhere at once. The press brake becomes a forging press for a split second.
That’s why coining is rare on modern press brakes outside thin material or specialty forming. The tonnage demand skyrockets so fast that only very short bend lengths are practical. A few inches, maybe. Not ten feet.
So when is it worth it?
When tolerance absolutely demands zero springback and the part is short enough that total tonnage stays inside machine and tooling limits. That’s a conscious engineering decision, not an operator’s shortcut because “the angle’s fighting me.”
Switch methods without recalculating and you’re not making a small adjustment. You’re jumping machine classes.
And even if total tonnage pencils out on paper, we haven’t talked yet about how that force is distributed along the bed — because 200 tons spread evenly is one thing, and 200 tons concentrated over a few inches is how shoulders crack and dies chip.
Picture this: 300‑ton press brake, 12 feet long. You run a 12‑foot air bend at 180 tons. Machine yawns. Hydraulics steady. Frame stays straight.
Next job is a 12‑inch bracket in 3/8‑inch plate. Calculator says 90 tons total. Well under 300. You smile, hit the pedal.
Ram comes down.
The machine survives. The die doesn’t.
Here’s why. That 90 tons isn’t spread over 12 feet anymore. It’s crammed into one foot. Ninety tons per foot. If your die is rated 80 tons per meter — about 24 tons per foot — you just asked it to carry nearly four times its limit. The brake is fine because total system tonnage is low. The tooling fails because it only cares about load density.
Total tonnage keeps the frame alive. Tonnage per foot keeps your tooling in one piece.
And charts almost never scream that distinction at you.
So how does that force actually move along the bed when you concentrate it?
A 200‑ton brake doesn’t deliver 200 tons equally everywhere along the bed. Look at any manufacturer’s load chart and you’ll see it: full-length distributed load might be close to rating, but center-loading capacity drops — sometimes to 50–70% of rated tonnage — because the ram and bed deflect.
Steel flexes. Always.
Under a heavy center load, the ram bows microscopically. The bed bows the opposite direction. You get a slight crown effect whether you want it or not. One accuracy report measured just 0.06 mm deviation over 3200 mm of table length. That tiny deflection translated into roughly 0.17° angle variation across the part.
Doesn’t sound like much until you’re chasing half-degree tolerance and shimming dies like a desperate man.
Now stack method on top of that. Bottom bending or coining spikes force at the bottom of stroke. That spike happens right when deflection is greatest. So not only are you increasing total tonnage with method multipliers, you’re amplifying localized stress exactly where the structure is weakest — mid-span.
Center-loading doesn’t just threaten catastrophic failure. It slowly beats accuracy out of the machine. The bed takes a set. The ram develops a bias. One day your parts are always open in the middle and tight on the ends.
What he never checks is the bed.
But even if your frame survives years of that abuse, your die doesn’t get years. It gets one bad hit.
Which brings us to the mistake I see more than any other.
Die manufacturers stamp ratings like “80 tons per meter” for a reason. That’s not decoration. That’s the yield limit of the tool steel across its cross-section.
Let’s do napkin math.
Step 1: Calculate total tonnage correctly — including material multiplier and bend method.
Step 2: Divide by actual bend length in feet.
Step 3: Compare that number to the die’s tons-per-foot rating.
Suppose your corrected bottom-bend calculation says 120 tons for a 10‑inch part. Ten inches is 0.83 feet.
120 ÷ 0.83 ≈ 145 tons per foot.
If your die is rated 80 tons per meter, that’s about 24 tons per foot.
You’re not a little over. You’re six times over.
Don’t be the guy who says, “But it’s only 120 tons and this is a 250‑ton brake.” That’s how shoulders chip and punches mushroom. The brake’s hydraulic system sees 120. The die shoulder sees 145 per foot concentrated at two contact lines.
And bottom bending shifts load outward toward the die shoulders. Acute dies make it worse. The contact area shrinks. Stress rises. Tool steel doesn’t give warning squeaks. It fractures.
You’ll hear a crack like a .22 going off inside the machine.
That’s a $10,000 mistake in one pedal stroke.
Modern tonnage calculators can give you solid total force numbers when you feed them correct inputs. They are not the enemy. The blind spot is that they output system tonnage, not load density. They assume you’ll check tooling ratings yourself.
Do you?
Even if your math says you’re within the die’s rated tons per foot, don’t run at 100%.
Ratings are based on ideal alignment, perfect material, no off-center loading, no deflection stacking from worn beds. Real shops are not ideal conditions. Material tensile strength varies heat to heat. Operators over-penetrate chasing angle. Crowning isn’t always dialed in.
High‑precision work sometimes needs more force than the chart suggests to hold angle and control springback. That means operators instinctively push deeper. Force rises fast near bottom.
So here’s the discipline: target no more than 80% of the die’s tons‑per‑foot rating and no more than 80% of the machine’s center-load capacity for that position on the bed.
If the die is rated 24 tons per foot, plan for 19.
If the machine’s center-load chart says 140 tons maximum in the middle, plan for 110.
That 20% buffer absorbs material variation, setup error, and the reality that the ram doesn’t stop on a dime. It buys you tool life. It buys you consistency. It keeps the ram from becoming a point-of-no-return regret.
Because once the ram comes down, physics doesn’t negotiate.
So before the next section hands you a clean decision framework, ask yourself something simple: when you look at a tonnage number, are you seeing total force — or the force per foot that actually decides whether steel bends… or snaps?
You want a step-by-step framework that tells you, before you touch the pedal, whether the bend is safe for the machine and the tooling.
Good. Because hope is not a setup strategy.
We’ve already established that load density — tons per foot — is what kills tooling and slowly beats accuracy out of the frame. So the framework has to force you to think in that order: chart → real force → load per foot → machine limits → safety margin → physical verification. Miss one, and you’re the guy explaining a snapped die to the owner.
Here’s how you stop guessing and start verifying.
The chart is not the answer. It’s a lie detector.
Step one: pull the generic tonnage from the chart for your thickness and V-opening. That gives you a baseline in tons per foot for mild steel, air bend, ideal conditions.
Now do one simple comparison.
Does that number even live in the same neighborhood as your machine’s distributed capacity?
If the chart says 12 tons per foot and you’re planning a 10‑foot bend, that’s 120 tons total. On a 130‑ton machine, that’s already breathing hard before we correct for real material or method. The chart just told you this job is close to the edge.
But here’s where operators get sloppy. They stop there.
The chart assumes nominal thickness. Most sheet runs heavy. Five to fifteen percent heavy is common. If you don’t mic the actual thickness before calculating, you just injected error before the math even started. Don’t be the guy who trusts the label on the rack more than the calipers in his hand.
So the chart answers one question only: “Is this job obviously impossible?”
If it passes that sniff test, what do you actually verify next?
This is the discipline part. Same order, every job.
1. Measure reality. Actual thickness. Actual bend length. Actual material type. If you switched from A36 to 304 and didn’t change the multiplier, you didn’t calculate — you assumed.
2. Calculate corrected total tonnage. Base tons per foot × material multiplier × method multiplier × bend length. Air bend is your baseline. Bottom bending or coining? Multiply accordingly. High‑precision work sometimes needs more force than the chart suggests to hold angle and control springback — and that extra force must be intentional, not accidental.
Now you have total system tonnage.
3. Convert to load density. Total tons ÷ actual bend length (in feet). That’s the number your die feels. Not the machine. The die.
Compare that to the die’s rated tons per foot. Stay at or under 80% of that rating. That margin is not cowardice. It’s insurance against variation in tensile strength, penetration depth, and alignment error.
4. Check machine center-load capacity. Not rated tonnage. Center-load chart. If your calculated total tonnage exceeds 80% of the allowed center load for that span, you’re bending in the red zone even if the nameplate says you’re fine.
Machine rating is a ceiling. Center loading is gravity.
5. Verify the machine itself isn’t lying to you. What he never checks is the bed.
A table deviation of 0.06 mm over a long span can translate into measurable angle variation. If the bed has taken a set from years of abuse, your beautiful tonnage math won’t hold the angle across the part. Back‑gauge repeatability drifting beyond a few hundredths of a millimeter? Your bend line shifts, your effective lever arm changes, and your calculated force no longer matches reality.
One bad machine variable invalidates the entire calculation.
You see what this checklist does? It turns tonnage from a single number into a chain of dependent conditions. Break one link, and the result changes.
But all of that still hinges on one number you absolutely must know.
| Step | Description |
|---|---|
| 1. Measure reality. | Actual thickness. Actual bend length. Actual material type. If you switched from A36 to 304 and didn’t change the multiplier, you didn’t calculate — you assumed. |
| 2. Calculate corrected total tonnage. | Base tons per foot × material multiplier × method multiplier × bend length. Air bend is your baseline. Bottom bending or coining? Multiply accordingly. High‑precision work sometimes needs more force than the chart suggests to hold angle and control springback — and that extra force must be intentional, not accidental. Now you have total system tonnage. |
| 3. Convert to load density. | Total tons ÷ actual bend length (in feet). That’s the number your die feels. Not the machine. The die. Compare that to the die’s rated tons per foot. Stay at or under 80% of that rating. That margin is not cowardice. It’s insurance against variation in tensile strength, penetration depth, and alignment error. |
| 4. Check machine center-load capacity. | Not rated tonnage. Center-load chart. If your calculated total tonnage exceeds 80% of the allowed center load for that span, you’re bending in the red zone even if the nameplate says you’re fine. Machine rating is a ceiling. Center loading is gravity. |
| 5. Verify the machine itself isn’t lying to you. | What he never checks is the bed. A table deviation of 0.06 mm over a long span can translate into measurable angle variation. If the bed has taken a set from years of abuse, your beautiful tonnage math won’t hold the angle across the part. Back‑gauge repeatability drifting beyond a few hundredths of a millimeter? Your bend line shifts, your effective lever arm changes, and your calculated force no longer matches reality. One bad machine variable invalidates the entire calculation. |
You must know your verified tons per foot at the planned safety margin.
Not chart tons per foot. Not raw calculated tons per foot. Verified, corrected, and margin-adjusted.
Here’s the napkin version:
If your die is rated 24 tons per foot, your working ceiling is about 19. If your math says 21, you are not “a little over.” You are operating beyond the elastic comfort zone of tool steel.
Ram comes down.
Steel does not care that you were close.
And here’s the non‑obvious part you carry forward: the tonnage chart is not dangerous because it’s wrong. It’s dangerous because it stops your thinking too early. It feels precise, so you treat it like a specification. In reality, it’s a polite guess built on assumptions your shop violates every day.
The framework forces you to convert that guess into a verified load density inside known machine limits, with a buffer that absorbs reality.
Before the ram comes down, you should know three things cold: Your corrected total tonnage. Your verified tons per foot at 80% or less of tooling rating. Your machine’s allowable center load for that span.
If you don’t, you’re not bending metal.
You’re gambling with hardened steel and a frame that remembers every mistake.